
Validation report
Aporia's network is only as good as the simulations it learned from. This report checks the simulator against real crowds: with its default settings, JuPedSim does not match the experiments. A calibrated configuration does, on data it was not fitted to. It has been the default since 26 October 2026.
Verdict
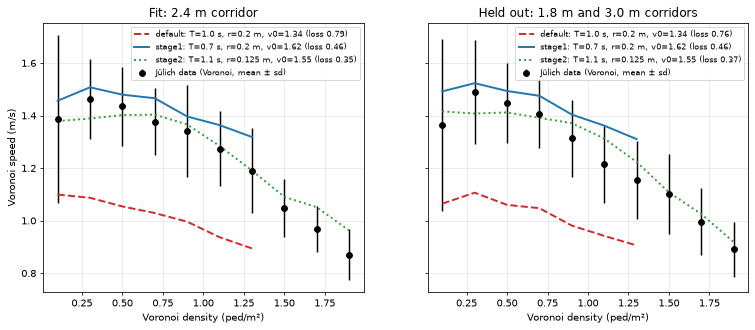
- Defaults are off. With JuPedSim's defaults, pedestrians walk about 0.3 m/s too slowly at every density in the Jülich corridors, and cut a 90° corner too close to its inner wall.
- The fix holds out. A shorter time gap (0.7 s), desired speeds measured on the same people, and lane routing match corridors, corners and an independent lab's bends that were never used to fit them.
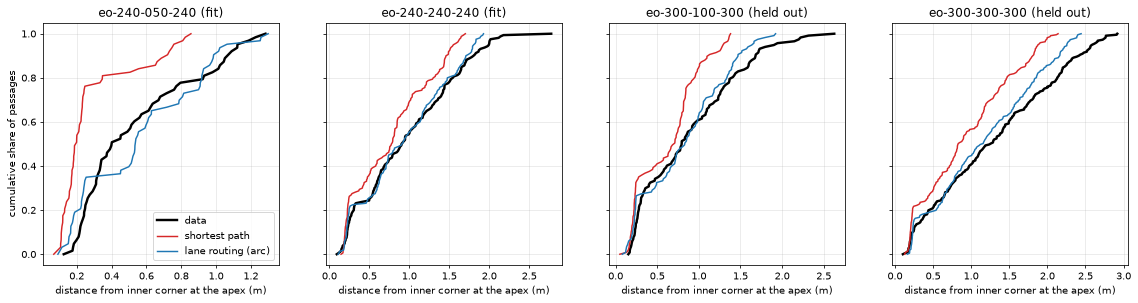
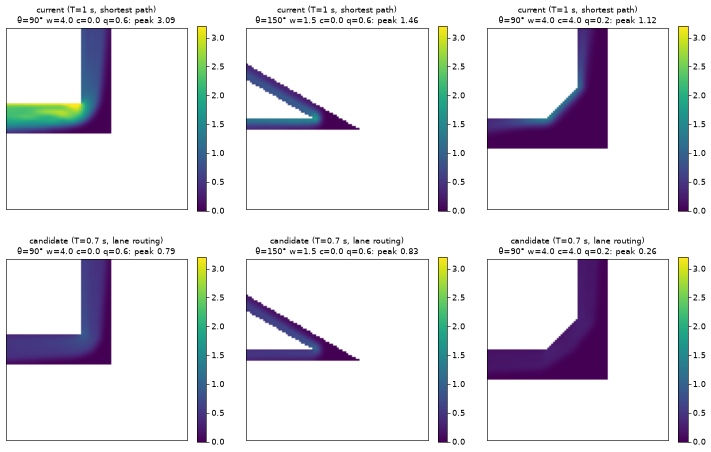
- Hugging the inner corner is partly real. Real crowds do pass close to it (60–98 % of passages in the inner half). Shortest-path routing exaggerates it; the candidate reproduces it. Peaks at the inner corner fall by up to 4× (90°, 4 m, q = 0.6: 3.10 → 0.79 ped/m²).
- What is validated is speed and density in corridors and where people pass in bends. Not the full density maps of bends, and not how people react to a chamfered corner.
What changed in the simulator
The local model is JuPedSim's collision-free speed model. Two things were changed, and they must be chosen together: lane routing with the default model still jams sharp, wide bends.
| Setting | Default | Validated | Source |
|---|---|---|---|
| Time gap T | 1.0 s | 0.7 s | Fitted, 2.4 m corridors |
| Desired speed | N(1.34, 0.26) m/s (Weidmann) | N(1.62, 0.16) m/s | Measured, 54 solo walks |
| Radius | 0.2 m | 0.2 m | Unchanged |
| Routing | Shortest path | Lane routing: 3-point arc, bias 0.3, radius 0.6 m | Fitted, 2.4 m corner |
Lane routing gives each walker waypoints that keep their lateral position through the turn, instead of steering everyone through the inner corner. It is a behavioural model with its own parameters, separate from the geometry.
Data and splits
Public experiments, converted to trajectories and measured with the same code as the simulations. Splits were fixed before any fitting; held-out sets were never used to make a choice.
| Experiment | Used for | Fit on | Held out |
|---|---|---|---|
| Jülich HERMES 2009, corridors | Time gap | 2.4 m, 6 runs | 1.8 m (6), 3.0 m (7) |
| Jülich 2009, 90° corner | Routing | 2.4 m, 6 runs | 3.0 m, 6 runs |
| Jülich 2009, individual walks | Desired speeds | 54 walks | – |
| Hannun et al. 2022, bends | Independent check | – | 45°, 90°, 135° at 1.5 m |
Walking speed in corridors
Each experiment is replayed: people enter where and when they were first seen. The loss adds the relative RMS difference of density and of speed, frame by frame, in a 2 m measurement area (Voronoi method).
Loss on held-out corridors · 1.8 and 3.0 m, lower is better
| Configuration | Fit loss, 2.4 m | Held-out loss | Speed error per density bin |
|---|---|---|---|
| Default: T = 1.0 s, v0 ~ N(1.34, 0.26) | 0.787 | 0.759 ± 0.050 | 0.33 m/s |
| Stage 1: T = 0.7 s, v0 ~ N(1.62, 0.16) measured | 0.465 | 0.459 ± 0.006 | 0.11 m/s |
| Stage 2: T = 1.1 s, r = 0.125 m, v0 mean 1.55 | 0.349 | 0.370 ± 0.005 | 0.06 m/s |
Why not stage 2? It fits better, but the time gap and the radius trade off along a ridge: the best points differ by 1–2 seed spreads, so the two cannot be told apart. Stage 1 has a single, interior optimum. Remaining misfit: about 0.1 m/s too fast at low density, and a flatter speed–density relation than the data. Densities above about 1.5 ped/m² are outside the calibrated range.
Turning a corner
Statistic: where each person crosses the apex of the turn, as distance from the inner corner. Simulated and measured distributions are compared by the 1-Wasserstein distance (W1): roughly, how far in metres the crossings must move on average to match the data.
In the data, inner-corner concentration is real: 60–98 % of passages lie in the inner half, more at low flow; the median distance is 0.4–1.25 m. Shortest path sends people within 0.2 m of the corner at low flow, where the data are at 0.4–0.6 m.
W1 on the held-out 3.0 m corner · metres, lower is better
| Routing, T = 0.7 s | W1 fit, 2.4 m | W1 held out, 3.0 m |
|---|---|---|
| Shortest path (JuPedSim) | 0.204 m | 0.315 m |
| Lane, apex point, bias 0.3, radius 0.3 m | 0.052 m | 0.085 m |
| Lane, apex point, bias 0.0, radius 0.6 m | 0.051 m | 0.066 m |
| Lane, arc (3 points), bias 0.3, radius 0.6 m | 0.061 m | 0.091 m |
Independent bends: Hannun et al.
Another lab, another population, a 1.5 m corridor, and angles never used (45°, 135°). Their data have one clock per person, so only paths are compared. Geometry was inferred from the paths (angles within 3° of nominal). The protocol is replayed: 55 people start together from a 6 × 6 m holding area.
W1 of apex passages · m, lower is better
Share of passages in the inner half · at the apex
| Angle | Shortest path, approach 4 / 6 / 8 m | Lane routing, approach 4 / 6 / 8 m |
|---|---|---|
| 45° | 0.160 / 0.151 / 0.150 | 0.143 / 0.134 / 0.138 |
| 90° | 0.118 / 0.139 / 0.135 | 0.120 / 0.111 / 0.105 |
| 135° | 0.125 / 0.131 / 0.142 | 0.121 / 0.114 / 0.115 |
Lane routing is better or equal in all nine settings, but by a small margin: in a crowded 1.5 m corridor the crowd fills the width whatever the route. The clearer signal is the inner-half share at 90° and 135°, where shortest path overshoots the data and lane routing does not.
Which runs are accepted
A 60-run grid (angles 0, 90, 150°; widths 1.5 and 4 m; sharp and fully chamfered; q = 0.2 and 0.6; 3 seeds), run with four configurations: the two changes, alone and together.
q = 0.2 ped/(m·s), 30 runs each
q = 0.6 ped/(m·s), 30 runs each
- The default's six failures are all 150°, 4 m bends at q = 0.6: arrivals refused, the bend is over capacity.
- Its low-flow runs are mostly inconclusive: about 5 people in view cannot resolve a 10 % change within 1,200 s. Inconclusive is never counted as a pass.
- All seven inconclusive candidate runs come from one small region (the inside of the turn) in 1.5 m bends.
What it changes in the maps
The training targets change materially. In wide bends at moderate flow, the default piles the crowd against the inner wall; the candidate spreads it across the width.
Diagnostics
Before fitting anything, four questions about the simulation itself.
- Is the run long enough?
- Not always with the default: 4 m bends at q = 0.6 are still filling up after 600 s (90°: drift 0.149 against noise 0.027 ped/m², occupancy 97 → 107). With the candidate, every case is stationary after 200 s (drift ≤ 1.5 × noise).
- Do the corridor ends matter?
- Barely. Lengthening the legs from 18/21 m to 24/27 m moves maps by at most 0.041 ped/m² (default) and 0.028 (candidate), far below the narrowest Fruin band (0.12). The shorter legs are kept.
- Does the measurement bias the result?
- Recording every 0.1 s instead of 0.5 s leaves density maps identical (≤ 0.003). Speeds in turns are biased low at 0.5 s, by up to 23 %: chords cut the arcs. The p99 peak depends on the smoothing width: σ = 0.3 m raises it 5–12 %, σ = 0.5 m lowers it 2–10 %; σ = 0.4 m is used throughout.
- Routing or local model?
- Both, together. Lane routing with the default model still jams 150°, 4 m bends at q = 0.6 (peaks 3.7–4.8 ped/m²).
How a run is judged
Every run goes through the same measurements and checks, whether simulated or real. 206 tests cover them.
- Density map
- Positions counted on a 0.25 m grid, smoothed with a Gaussian (σ = 0.4 m) that cannot see through walls, and divided by the exact walkable area of each pixel. Near walls the estimate is 0.989–1.014 of the true density (a simple pixel mask gives 0.968–1.014).
- Consistency
- Exact bookkeeping: everyone inside the walls, every arrival accounted for (requested = spawned + refused + waiting), the map's integral equal to the mean head count.
- Load
- Zero refused arrivals, and the measured outflow within 5 % of the requested flow.
- Stationarity
- The two halves of the window must agree within a tolerance fixed in advance: 10 % for the whole view, 20 % or 0.1 ped/m² for small regions. Standard errors are corrected for autocorrelation. A pass needs |difference| + 2 se ≤ tolerance; too few independent samples can only fail or stay inconclusive.
- Outcome
- Each check ends pass, fail, inconclusive or not applicable, with its value, threshold and reason. Rejected runs are kept.
Gate and pilot
Large-scale generation was allowed only once every condition below held. The gate opened on 26 October 2026.
| Condition | Status |
|---|---|
| Numerical tests pass | 206 tests |
| Accepted runs pass consistency, load and stationarity; rates reported by angle, width, load | Yes, rejected runs kept |
| Routing and local model have independent support | Held-out widths, plus an independent lab and angles |
| Versions and settings pinned | aporia.validated, checked by a test |
| Demand restricted to a range verified for bends | q ≤ 0.9 by the pilot, then q ≤ 0.7 (dataset v2) |
| Pilot, two seeds per geometry, worst cases inspected | 79 / 80 accepted |
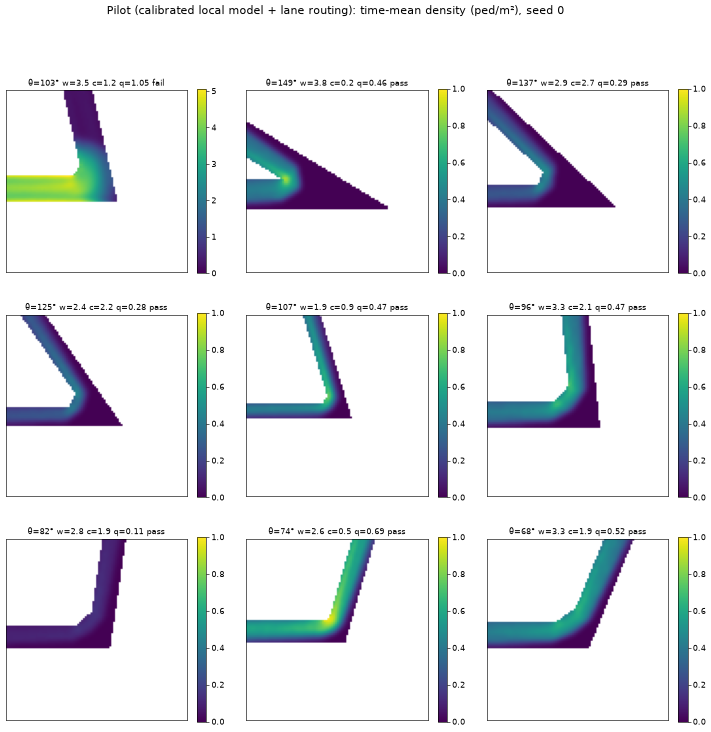
Pilot: 40 random bends over the full range (θ 30–150°, w 1.5–4 m, chamfer 0–w, q 0.1–1.1), two seeds each. All 68 runs below q = 0.9 pass, and 11 of 12 between 0.9 and 1.1. The one failure (θ = 103°, w = 3.5 m, q = 1.05) jams at 4.9 ped/m² while its other seed passes: q ≈ 1 is the edge of a bend's capacity. Two seeds of the same bend differ by 0.016 ped/m² RMS (median, max 0.032), so a two-seed mean is known to about 0.008.
Limits
- Extrapolation. Widths above 3.0 m, angles above 135°, densities above about 1.5 ped/m², and other populations: the speeds are those of German students in 2009 (1.62 ± 0.16 m/s). Older or mixed crowds walk slower (Weidmann: 1.34 m/s).
- Model. The speed–density relation is flatter than observed; the model gridlocks at narrow exits; lane routing is a surrogate, validated on where people pass, not on full density maps of bends; a chamfer's effect on real walkers is untested.
- Selection. The routing constraint was added after a failure was seen. Held-out sets were not used for any choice.
- Measurement. Speeds in turns from 0.5 s recordings are too low; the p99 peak depends on σ. Low-flow or small-region stationarity often cannot be certified in affordable runs: such runs are inconclusive, never silently accepted.
- Hannun replay. Approach length, speed spread and holding-area layout are assumptions (sensitivity to the approach shown above).
- Scope. One-way, steady flow below capacity. No counter-flow, pushing or evacuation.
Reproduce
Every number on this page comes from one of these commands of the Aporia pipeline. The resulting training bends are public: aporia-bends on Hugging Face.
uv run aporia fetch-data            # datasets, checksums verified
uv run aporia calibrate             # corridors, corner, Hannun (~8 min, 10 cores)
uv run aporia experiment baseline   # 60-run grid, default configuration
uv run aporia experiment crossed    # the three other configurations
uv run aporia experiment diagnostics
uv run aporia experiment pilot && uv run aporia report pilot
uv run pytest                       # 206 tests